————————————————————————————————
Monthly Discussion
The American
Economy
There can be many indicators
for the economy but some of the most frequently used are: GDP growth,
unemployment, and interest rates. They are among the indicators reflecting the
so-called fundamentals. Without going into the debate whether they do indeed
present an accurate picture of the economy’s health or not, I will venture here
to forecasting them invoking natural-growth processes behind them. The
historical window I consider extends back to the end of World War II thus
comprising an integral chapter in the evolution of American economy.
The evolution of the GDP is shown in
Figure 3. The agreement between the data and the fitted natural-growth curve is
excellent. The post-war growth phase seems 65.4% completed by the end of Q2 of
year 2002. And the forecast for the upcoming quarters is given in Table 1.
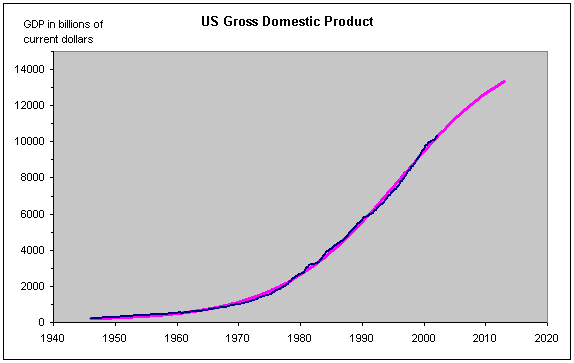
Exhibit 3.
The purple line is an S-curve fit to the data. The goodness of the fit
argues for the validity of the forecast.
Table 1
|
Year.qt |
GDP |
% growth |
|
2002.q3 |
10382.84 |
0.9% |
|
2002.q4 |
10472.07 |
0.9% |
|
2003.q1 |
10560.55 |
0.8% |
|
2003.q2 |
10648.26 |
0.8% |
|
2003.q3 |
10735.17 |
0.8% |
|
2003.q4 |
10821.27 |
0.8% |
|
2004.q1 |
10906.55 |
0.8% |
|
2004.q2 |
10990.98 |
0.8% |
|
2004.q3 |
11074.55 |
0.8% |
|
2004.q4 |
11157.26 |
0.7% |
The evolution of employment is shown in Figure 4 in terms of the ratio employment over population. Another natural-growth process but this time following a cyclical path winding above and below the S-shaped trajectory. Interestingly, this growth process seems much closer to completion (91.3% completed). In the post-WWII US society the employment ceiling seems to be just about 2 out of 3 inhabitants. This is not unreasonable considering the fraction of the population (children, invalids, and senior citizens) not capable to work.
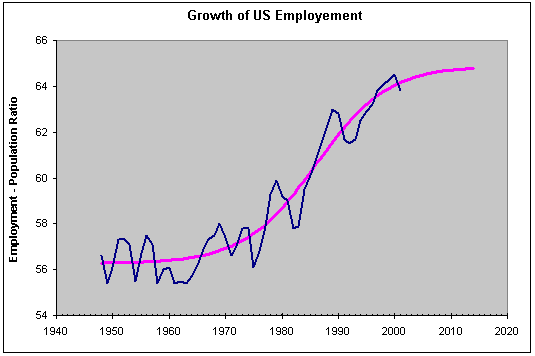
Exhibit 4. The evolution of US employment is cyclical
around the S-curve that describes the post-WWII growth phase.
Extracting
the cyclical variation as the ratio data to S-curve reveals a rather regular
swing above and below the smooth trajectory, see Figure 5. In such cases a
simple and accurate forecast is obtained via autocorrelation, namely by
displacing the curve forward by one cycle (green curve in Figure 5). This way
we can obtain a forecast for the variation, which when folded with the forecast
of the general trend from Figure 4 gives the employment forecast shown in Table
2.
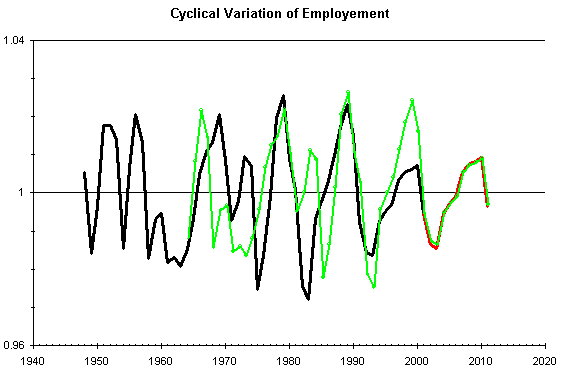
Exhibit 5. The green line is the black one displaced by one cycle. This way we obtain the forecast (red line underneath the green one)
Table 2
|
Year |
Employment_to
population ratio |
Annual % change |
|
2002 |
63.37983 |
-0.6% |
|
2003 |
63.40474 |
0.04% |
|
2004 |
64.05384 |
1.02% |
|
2005 |
64.30176 |
0.39% |
|
2006 |
64.45865 |
0.24% |
|
2007 |
64.93283 |
0.74% |
|
2008 |
65.11312 |
0.28% |
|
2009 |
65.20382 |
0.14% |
|
2010 |
65.30616 |
0.16% |
|
2011 |
64.50939 |
-1.22% |
Finally the evolution of interest rates in America are
shown in Figure 6. Here the fitted curve is a bell-shaped one. The reasoning
for this choice is that while an investment may grow along a natural-growth
process (S-curve), interest rates reflect the rate of growth and thus
follow bell-shaped curves (the S-curve’s life cycle). Once again, we find that
the process is rather complete (96%). The forecast for the general trend of the
interest rates are shown in Table 3.
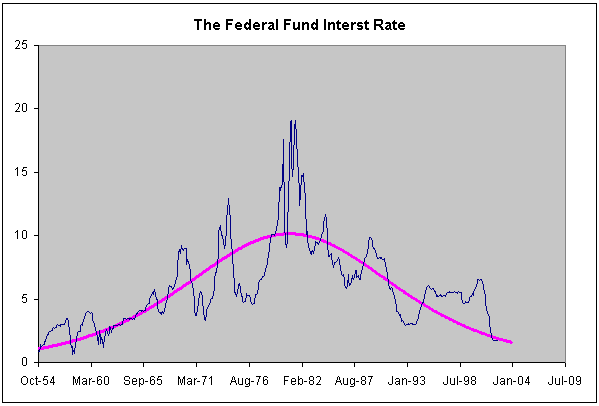
Exhibit 6. The purple line is a bell-shaped curve fit
to the data.
Table
3
|
Year |
Interest rate |
|
Oct-02 |
1.83 |
|
Nov-02 |
1.81 |
|
Dec-02 |
1.79 |
|
Jan-03 |
1.78 |
|
Feb-03 |
1.76 |
|
Mar-03 |
1.74 |
|
Apr-03 |
1.72 |
|
May-03 |
1.70 |
|
Jun-03 |
1.69 |
|
Jul-03 |
1.67 |
|
Aug-03 |
1.65 |
|
Sep-03 |
1.63 |
|
Oct-03 |
1.62 |
|
Nov-03 |
1.60 |
|
Dec-03 |
1.58 |
CONCLUSIONS
The post-WWII niche of the American
economy is a growth process well into its maturity. The GDP went through a
maximum rate of growth in the 1990s and is now slowing down. We should not expect
more than 0.8-0.9% growth in current dollars per quarter. The employment’s most
significant trend seems to be a 10-year cycle that approaches a minimum around
the end of 2002 and beginning of 2003. And interest rates will have dropped by
only another 25 percentage points by the end of 2003.
All this, unexciting as it may seem, corroborates
the trend of the long-term forecast of the stock market (red line in Figure 1).
Could a war in Irak change things? Not unless its
aftermath becomes as dramatic as that of WWII, thus creating another niche for
growth.