Monthly
Discussion
Household
Financial Assets
The
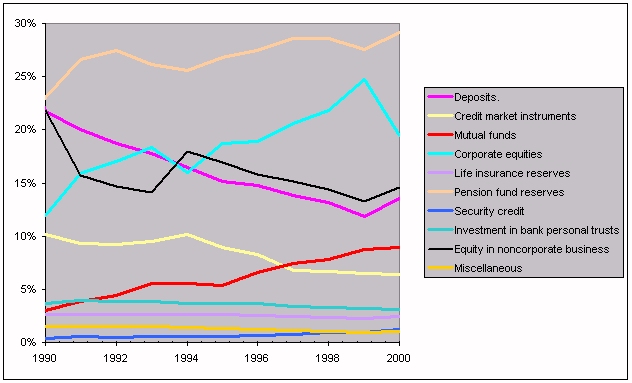
way American households manage their financial assets depends on the American
economy but also influences it. Among the ten major alternatives for placement
presented by the Statistical Abstract of the United States (see
Exhibit 3) one can distinguish 6 major ones (two-digit shares) and 4 minor
ones (with shares confined to a few percent or less). Among the major ones one
may want to further identify 3 “winners” and 3 “losers”. The shares of the
former are generally rising in the expense of the shares of the latter. The 4
minor placement alternatives are rather flat over time. Like “by-standers” they
don’t seem to interact with the evolution of the others.
The Split of Household Financial Assets
Exhibit
3. The way household financial assets
have evolved relative to each other in the U.S. during the last 11 years. The
shares of ten major categories are shown on a linear vertical scale.
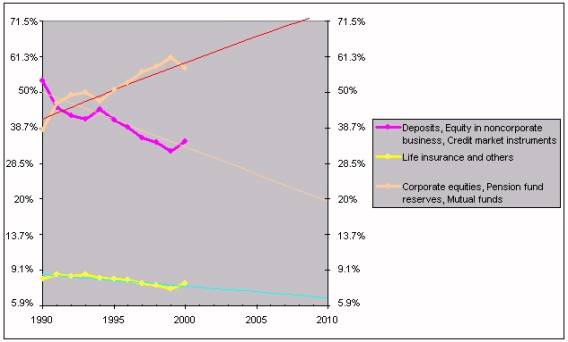
If we group the above ten instruments into
“winners”, “losers” and “by-standers”, we can then use the logistic
substitution model to understand and forecast their behavior. The logistic
substitution model, described in Predictions, assumes that
various entities (in this case the various placement instruments) compete for a
limited resource (in this case the household assets) in a Darwinian way, i.e.,
via the law of the survival of the fittest. The model’s predictive power lies
in the fact that natural evolution follows S-curve trajectories that
generally proceed to completion.
In a macroscopic view, see Exhibit 4, “winners”,
“losers”, and “by-standers” all seem to have embarked in logistic S-shaped
trajectories. “Losers” (purple line) are seen to phase out along a declining
S-curve while “winners” (orange line) are phasing in along a growing S-curve.
Three Groups of Placement Instruments
Exhibit
4. “Winners” in orange, “Losers” in
purple, and “By-standers” in yellow compete for household financial assets. The
thin lines are projections according to the Logistic Substitution Model. The
vertical scale is logistic, transforming S‑curves to straight
lines. By 2010 74% of household assets will be found in pension fund reserves,
corporate equities, and mutual funds.
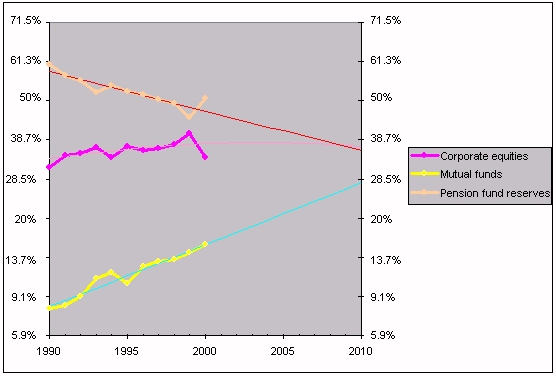
The winners are pension fund reserves,
corporate equities, and mutual funds, in decreasing order of importance. But
despite the fact that pension funds today may be three times more important
than mutual funds, ten years from now the niche of the winners becomes more or
less equally divided between the three contenders, see Exhibit 5.
The Niche of the “Winners”
Exhibit
5. The detailed competition between the
three “winners”. The thin lines are projections according to the Logistic
Substitution Model. Once again the vertical scale is logistic
transforming S-curves to straight lines.
Mutual funds have embarked on a steadily growing
S-curve promising to claim 28% of the winners’ niche by 2010. Stocks took a
beating in 2000, which was probably further exacerbated in 2001 (the data are
not yet available), and pension fund reserves picked up the losses. But despite
these gains, pension funds reserves have demonstrated that they have been
following a declining S‑curve. The two well-established S‑curves
dictate the future of the third contender, the equities, (thin purple line). By
2010 only 36.7% x 74% = 27% of all household assets are to be found in
corporate equities. Another as much is to be found in pension fund reserves and
20% in mutual funds. All other options will have to content themselves with the
remaining 26% of household assets.
Americans’ love-hate relationship with stocks seems
to be coming of age and settling just below the level of 1/3 of the average
household financial assets.