————————————————————————————————
Monthly Discussion
NASDAQ’s Share of the Market
Five
years ago we examined in this Newsletter the progressive growth of NASDAQ on
the expense of NYSE (see Newsletter issue of April 24, 2000).
It
is argued in that issue that NASDAQ had gained market share on NYSE progressively
during the last three decades of the 20th century. These gains followed four consecutive
S-curves according to the usual pattern of sustained growth, namely S-shaped
steps interspersed by horizontal segments (low-growth stagnating periods).
During the low-growth periods between successive
S-curves large fluctuations appear rendering this period rather chaotic see
Exhibit 3 (for a full discussion see Chapters 2&3 of Conquering Uncertainty). It is
during this chaotic period when changes in direction become possible. In fact
chaos scientist refer to this period as bifurcation because the
continuation may upward or downward. In Exhibit 3 we see two successive
growth steps followed by a declining step instead of the desirable third growth
step.
Cascade of Natural Growth Processes
Exhibit
3. A typical pattern of S-curve succession does
not necessarily guarantee sustained growth. Following a chaotic (bifurcation)
period, we may enter a downward rather than an upward new curve.
This is what happened to NASDAQ’s advances over
NYSE. Its last growth phase ended in early 2000 and following a stagnating year
with no growth and much fluctuation (chaotic state) a several-year-long declining
phase set in. This can be seen in Exhibit 4.
NASDAQ $ Volume as % of (NYSE+NASDAQ)
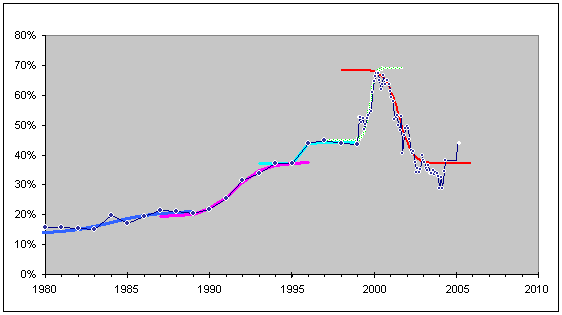
Exhibit 4. S-curves are fit on the data under the assumption that NASDAQ and
NYSE compete for investors’ dollars the same way rabbits compete for grass.
Annual data points are shown here but the analysis is based on daily data.
Monthly data points are shown between May 2000 and May 2004 (white circles).
Four successive upward steps were followed by a downward step. The white dot is
the daily value on February 8, 2005.
Today it seems that the declining phase has been
completed. Even the chaotic stagnating phase following the decline may have
been completed. But whether we are about to witness a new growth phase or
further decline remains questionable. Do not be carried away by the last rising
data point (white dot). My data stopped in May 2004 and the last rise is due to
only a daily value reported on February 8, 2005.
A state of chaos is a period of bifurcation
following which all directions are possible. If you ask my opinion, we are to
remain in the horizontal chaotic state for some time to come.